Introduction
A few months back, we faced a significant challenge with our production database running MySQL 5.7. The issue was straightforward yet daunting: our MySQL server was consuming an unexpectedly high amount of memory, leading to degraded performance and, occasionally, service interruptions. This situation prompted us to embark on a comprehensive journey to understand how MySQL uses memory and to discover the tools and strategies necessary for monitoring and optimising memory usage effectively.
This blog post aims to share insights from our experience, focusing on the technical aspects of MySQL’s memory usage, the utilisation of the Performance Schema, and the sys schema to monitor and optimise memory. This post will provide valuable information to help you manage memory usage in MySQL efficiently.
How MySQL Uses Memory
MySQL uses memory in a multifaceted way to ensure data processing efficiency, query performance, and overall system reliability. Understanding these mechanisms is crucial for effective memory management and optimisation. Here’s a breakdown of the key memory utilization aspects in MySQL:
Global Memory Allocations
MySQL allocates memory globally for several buffers and caches that are shared among all connections. Notable among these are the InnoDB buffer pool, the query cache, and the thread cache. The InnoDB buffer pool is particularly crucial as it caches data and indexes for InnoDB tables, significantly impacting performance.
Tuning the InnoDB Buffer Pool Size
When increasing or decreasing innodb_buffer_pool_size, the operation is performed in chunks. Chunk size is defined by the innodb_buffer_pool_chunk_size configuration option.
The size of the InnoDB buffer pool must be a multiple of innodb_buffer_pool_chunk_size * innodb_buffer_pool_instances. If the set innodb_buffer_pool_size does not meet this criterion, MySQL automatically corrects it to comply, ensuring efficient memory allocation and system performance.
The innodb_buffer_pool_size configuration option can be set dynamically using a SET statement, allowing you to resize the buffer pool without restarting the server. For example:
SET GLOBAL innodb_buffer_pool_size = 1024 * 1024 * 1024; -- Adjust based on your workload and observationsCode language: PHP (php)This command configures the InnoDB buffer pool size, which is crucial for caching data and indexes of InnoDB tables.
The resizing process can be monitored via Innodb_buffer_pool_resize_status or via server logs. For example:
SHOW STATUS WHERE Variable_name='InnoDB_buffer_pool_resize_status';Code language: JavaScript (javascript)
Note Active transactions and operations performed through InnoDB APIs should be completed before resizing the buffer pool. When initiating a resizing operation, the operation does not start until all active transactions are completed. Once the resizing operation is in progress, new transactions and operations that require access to the buffer pool must wait until the resizing operation finishes
Per-Connection Memory Allocations
Every client connection to MySQL requires memory for session-specific resources such as sort buffers, join buffers, and temporary tables. These allocations are dynamic and depend on the queries being executed. For complex queries involving sorting, grouping, or temporary table creation, MySQL might allocate additional memory, which increases the per-connection memory footprint.
Sort buffer is the buffer used for sorting data during the creation of an InnoDB index. Sort buffer size is configured using the sort_buffer_size system variable.
Join Buffer is the buffer that is used for plain index scans, range index scans, and joins that do not use indexes and thus perform full table scans
Temporary Table is a table whose data does not need to be truly permanent. For example, temporary tables might be used as storage areas for intermediate results in complicated calculations or transformations.
Analyzing Sort Buffer Usage
To identify queries that require large sort buffers, you can monitor the status variables like Sort_merge_passes and adjust the sort_buffer_size as needed:
SHOW STATUS LIKE 'Sort_merge_passes';Code language: JavaScript (javascript)This command helps identify if MySQL has been performing many Sort_merge_passes, indicating that increasing the sort_buffer_size might improve the performance of ORDER BY or GROUP BY operations that cannot be improved with query optimisation or improved indexing.
To set sort_buffer_size permanently
- Locate your MySQL server’s main configuration file
- Find the [mysqld] section in the file, and add or modify the sort_buffer_size option
For example, to set the sort_buffer_size to 4MB, you would add
[mysqld]
sort_buffer_size = 4M
Note Adjusting sort_buffer_size requires careful consideration as it is allocated for each client connection and can significantly impact memory usage and performance. For further specifications related to sort_buffer_size please refer to MySQL docs here
Thread Memory Allocations
MySQL’s server threads consume memory for various operations. For instance, InnoDB uses additional memory for background threads performing tasks like flushing dirty pages from the buffer pool or merging insert buffer entries.
Dirty Page is a page in the InnoDB buffer pool that has been updated in memory, where the changes are not yet written (flushed) to the data files
All threads share the same base memory. When a thread is no longer needed, the memory allocated to it is released and returned to the system unless the thread goes back into the thread cache. In that case, the memory remains allocated.
Configuring the Thread Cache Size
Thread Cache Size tells us how many threads the server should cache for reuse. By examining the difference between the Connections and Threads_created status variables, we can see how efficient the thread cache is.
Connections variable tells the number of connection attempts (successful or not) made to the MySQL server and Threads_created tells the number of threads created to handle connections. If Threads_created is big, you may increase the thread_cache_size value. The cache miss rate can be calculated as Threads_created/Connections.
Increasing the thread cache size can help improve performance, especially in environments with a high rate of new connections.
For instance, if 100 connections are created per second and each thread takes 1 second before it goes back into the thread cache. The thread_cache_size should be 100 so that all new connections use cached threads.
SET GLOBAL thread_cache_size = 100; -- Adjust based on your workload and observationsCode language: PHP (php)However, it’s important to note that the actual optimal thread_cache_size value may vary based on the specific details of your workload and server configuration
Understanding these aspects is the foundation for diagnosing and addressing memory usage concerns in MySQL.
Monitoring MySQL Memory Usage
To effectively manage and optimize memory in MySQL, it’s essential to monitor its usage accurately. MySQL offers two powerful tools for this purpose: the Performance Schema and the sys schema.
Performance Schema
The Performance Schema is a feature-rich tool that provides detailed insights into MySQL server execution at a low overhead. It includes numerous instruments and consumers that can be configured to monitor various aspects of the MySQL server, including memory usage.
The Performance Schema tracks memory allocation and deallocation operations for memory diagnostics, offering visibility into how memory is used across different MySQL components.
To leverage the Performance Schema for monitoring memory usage, it’s important to enable the specific instruments related to memory and configure the consumers that collect and store this data. Once configured, queries can be executed against the Performance Schema’s tables to analyze memory usage metrics.
Enabling Memory Instruments
First, enable the memory instrumentation:
UPDATE performance_schema.setup_instruments SET ENABLED = 'YES', TIMED = 'YES'
WHERE NAME LIKE 'memory/%';Code language: JavaScript (javascript)
Then, query the memory usage by instrument:
SELECT * FROM performance_schema.memory_summary_global_by_event_name
WHERE COUNT_ALLOC > 0;Code language: CSS (css)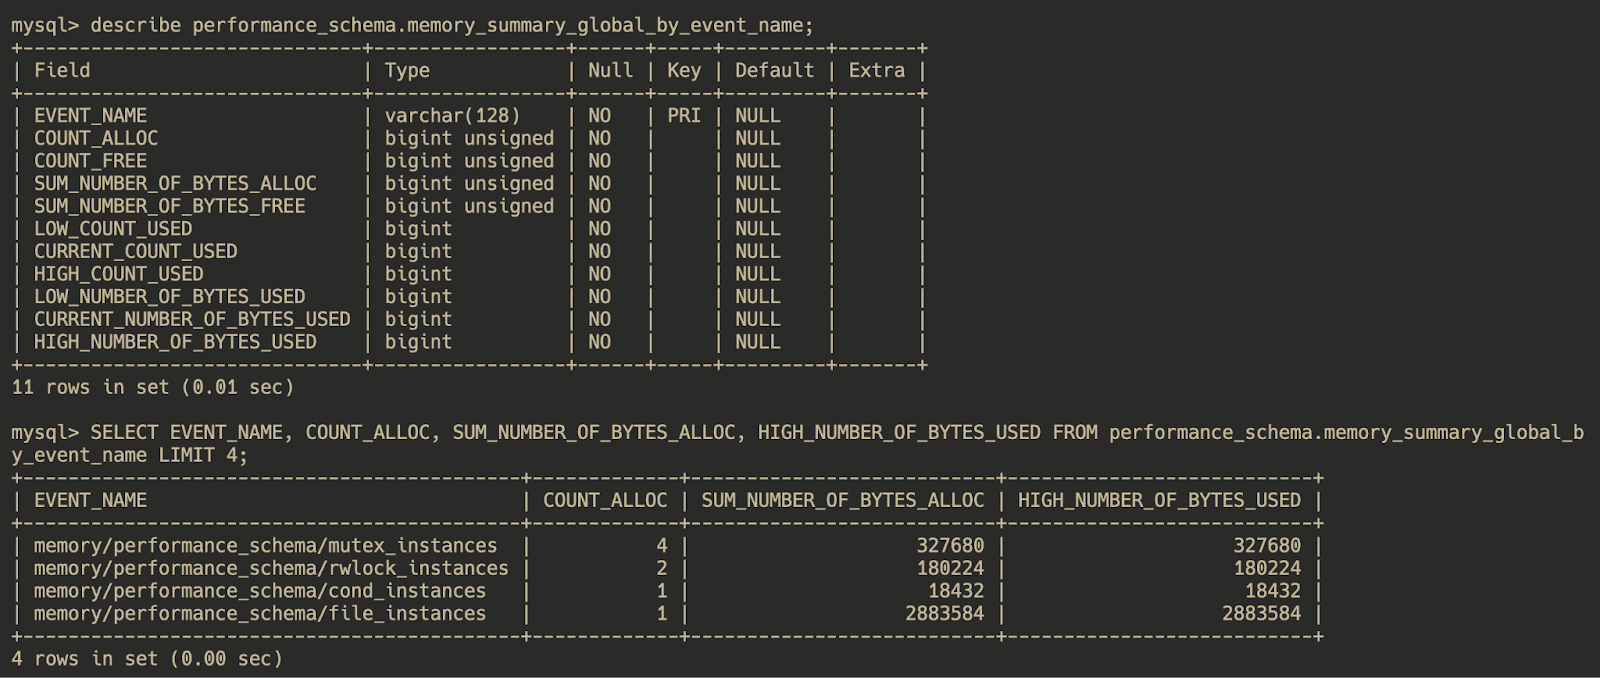
These queries activate memory instruments and display memory usage by each instrument, allowing for detailed analysis.
Server monitoring occurs continuously and unobtrusively with very little overhead. Activating the Performance Schema does not make the server unusable.
sys Schema
The sys schema provides a high-level view of the information collected by the Performance Schema, simplifying the monitoring and analysis of MySQL performance metrics, including memory usage.
It includes pre-defined views and procedures that encapsulate complex Performance Schema queries, making it easier for administrators and developers to understand and optimize MySQL’s performance.
For memory monitoring, the sys schema offers views like memory_global_total and memory_by_thread_by_current_bytes, which present aggregated memory usage data. These views are instrumental in identifying high memory usage patterns and pinpointing the sources of memory consumption.
Viewing Global Memory Usage
To get a summary of global memory usage:
SELECT * FROM sys.memory_global_total;Code language: CSS (css)
And to analyze memory usage by thread
SELECT * FROM sys.memory_by_thread_by_current_bytes;Code language: CSS (css)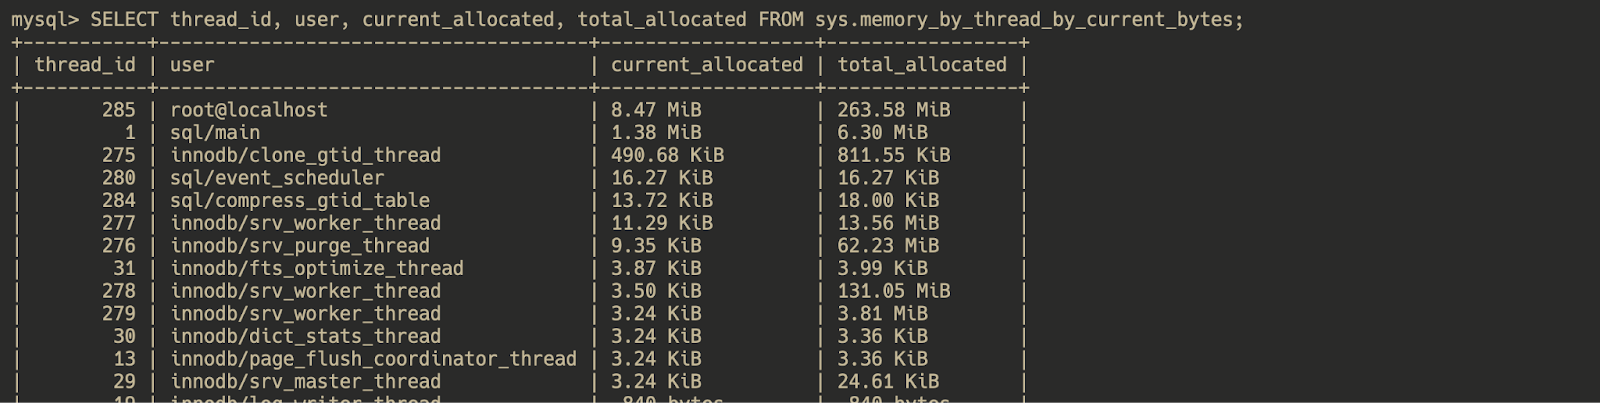
These views provide a simplified interface to the Performance Schema’s memory usage data, making it easier to identify and address memory usage concerns.
Bonus: Regular Monitoring and Analysis
Using the Performance Schema and the sys schema, establish a routine for monitoring memory usage, identifying trends, and making adjustments as necessary to maintain optimal performance.
Routine Monitoring Query
SELECT EVENT_NAME, COUNT_STAR, SUM_TIMER_WAIT as TOTAL_WAIT_TIME_ALLOCATED
FROM performance_schema.events_stages_summary_global_by_event_name
WHERE SUM_TIMER_WAIT > 0
ORDER BY SUM_TIMER_WAIT DESC;Code language: JavaScript (javascript)
This query provides insights into the memory usage by different stages and events, helping in regular monitoring and analysis for memory optimization
Conclusion
Optimizing memory usage in MySQL is a critical aspect of database administration that requires a deep understanding of how MySQL uses memory and the tools available for monitoring and analysis. By leveraging the Performance Schema and the sys schema we can gain valuable insights into memory usage patterns and make informed decisions to optimize memory allocation. Our experience in addressing high memory consumption in our production database underscores the importance of continuous monitoring, analysis, and optimization to ensure MySQL runs efficiently and reliably.
References
MySQL 5.7 Official Documentation: https://dev.mysql.com/doc/
https://cloud.google.com/mysql/memory-usage
Read about Mitigating High CPU Usage in MySQL


1 Comment
temp mail
What a fantastic resource! The articles are meticulously crafted, offering a perfect balance of depth and accessibility. I always walk away having gained new understanding. My sincere appreciation to the team behind this outstanding website.