Recently while working on a project of migrating a monolith to microservice architecture, we faced certain problems and got to work on the root cause analysis of the same. In the process, we got to learn some categories of problems in microservice architecture and shared it with the team through a talk and later thought of documenting it in this doc.
Microservices are a popular architectural approach that offers a variety of benefits, including scalability, flexibility, and the ability to isolate failures. However, with these benefits comes the potential for new categories of failures. Understanding these failures and implementing effective countermeasures is critical to the success of microservice architecture. In this talk, we will explore common categories of failures in microservice architecture and measures to tackle those failures. Later we will discuss the concept of MTTR.
Microservice Failures
💡 We first describe four common types of failures here and dive into the existing mechanisms to resolve them.
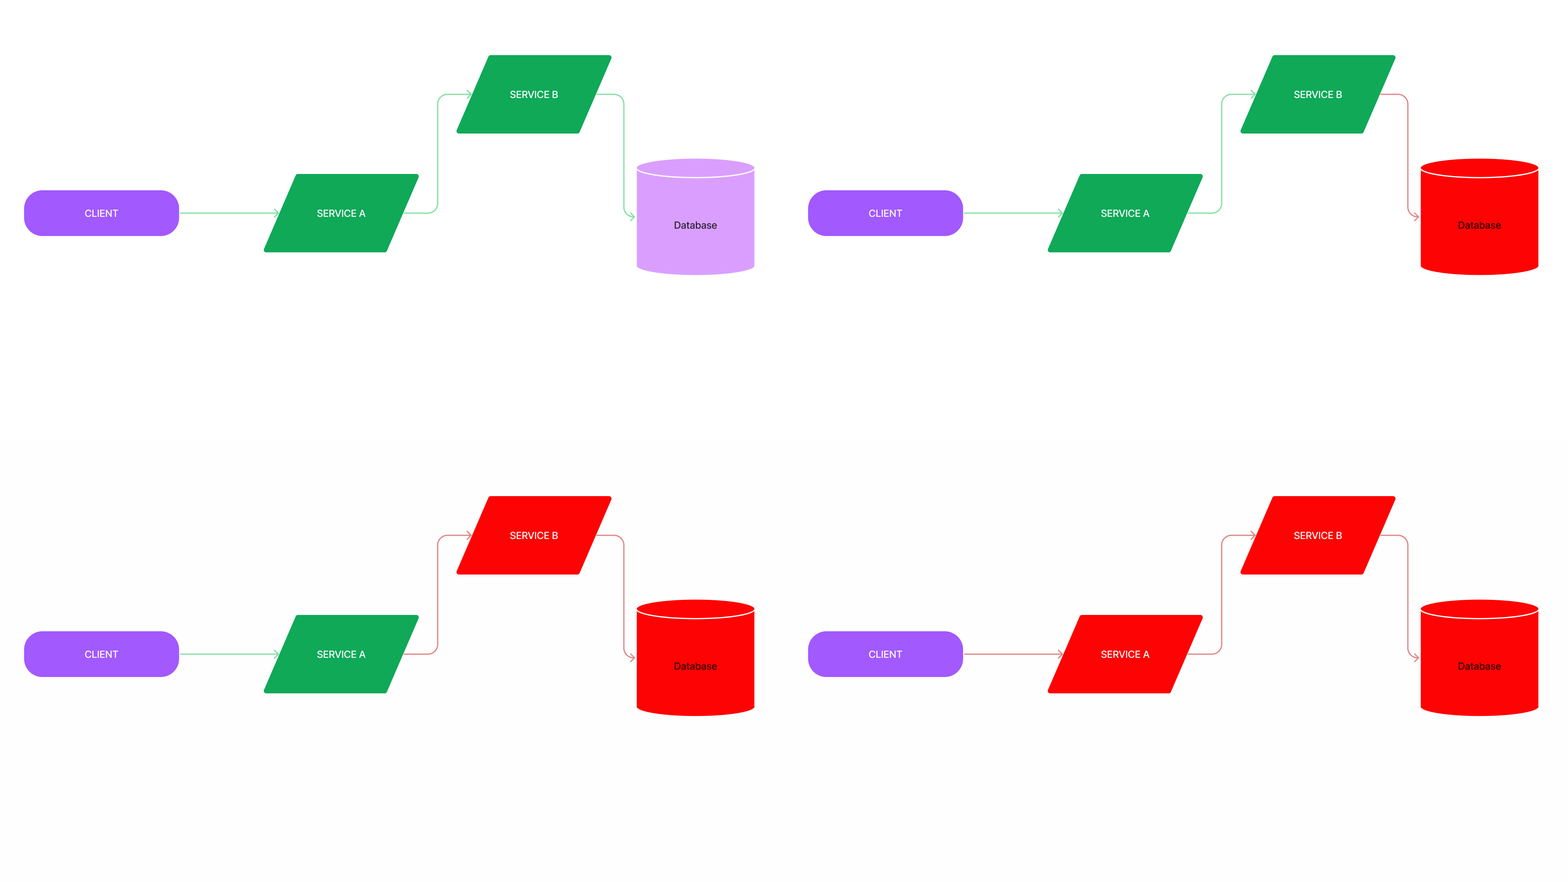
Cascading failure
💡 a chain reaction of different interconnected services failing
- Cascading failure refers to the phenomenon where the failure of a single service leads to a chain reaction of failures in other services.
Retry storm
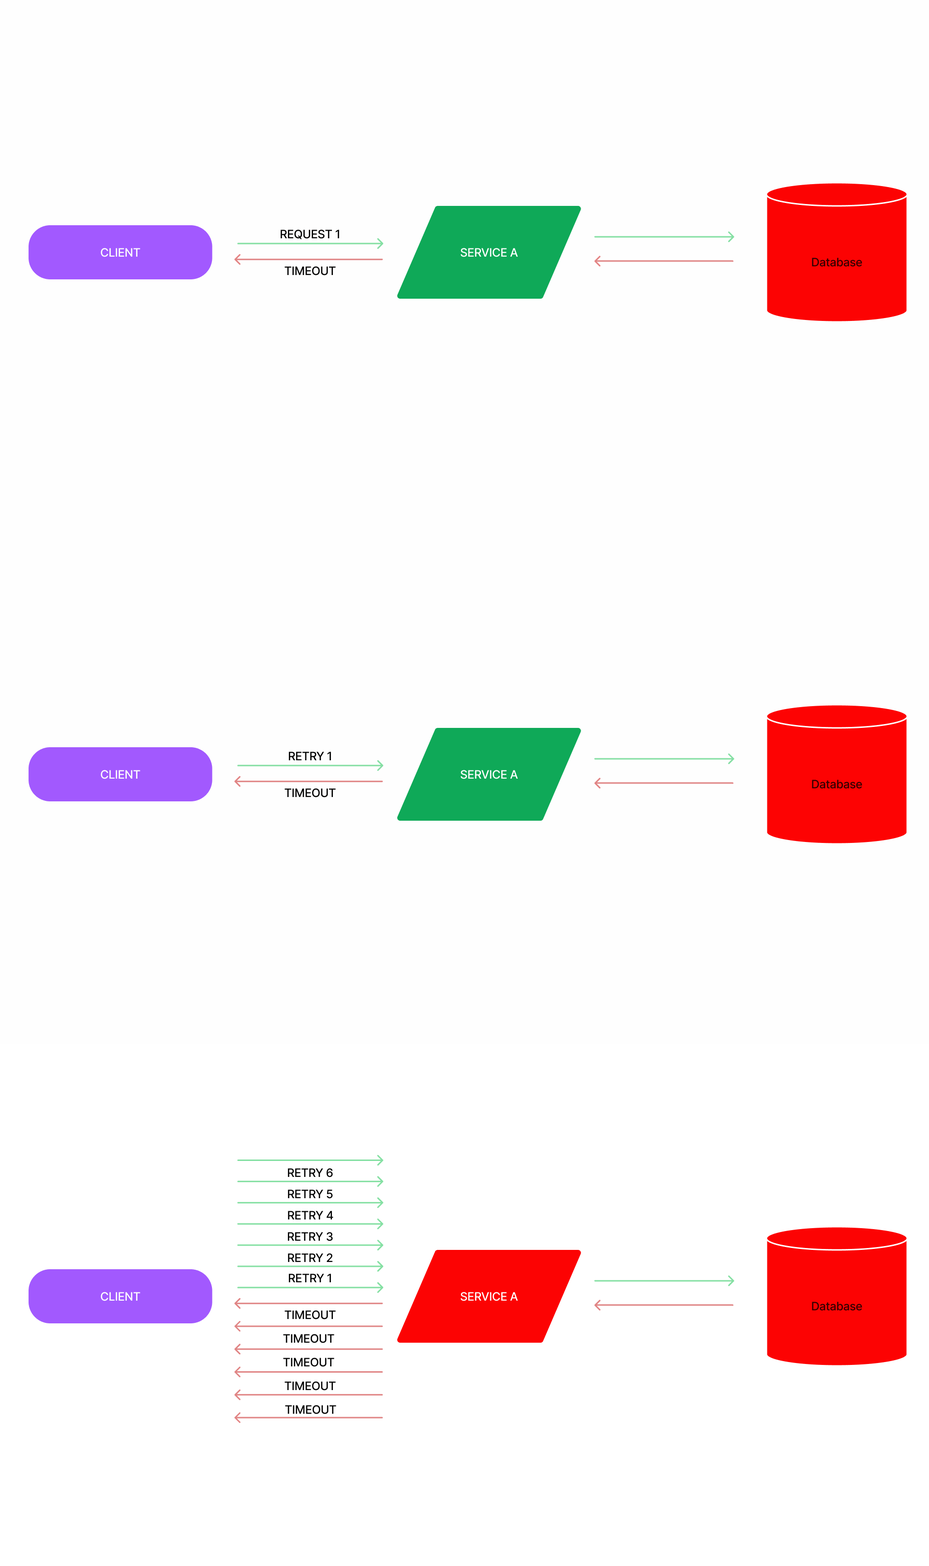
💡 when retries put extra pressure on a degraded service
- sites are often implemented with timeouts and retries to make every call more likely to succeed.
- retrying a request is very effective when the failure is transient.
- However, retries worsen the problem when the service is unavailable or slow, since in that case, most requests will end up being retried multiple times and will ultimately fail.
- This scenario where excessive and ineffective retries are applied is called work amplification, and it causes an already degraded service to degrade further.
Death Spiral
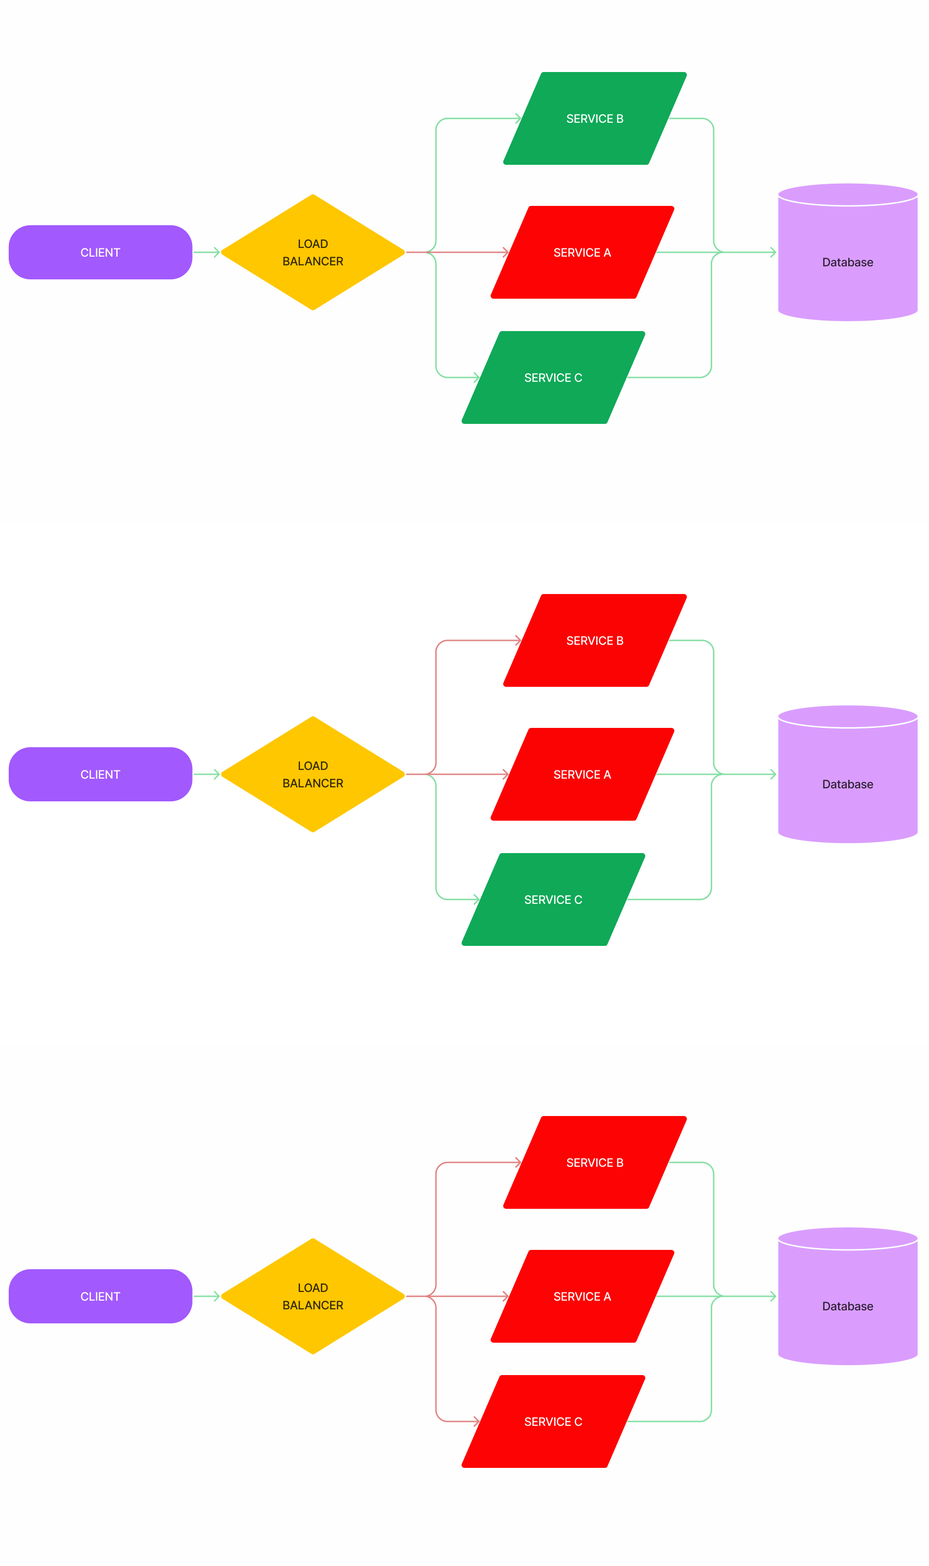
💡 some nodes fail, causing more traffic to be routed to the healthy nodes, making them fail too
- Failures can frequently spread vertically through a request call graph across services.
- but they can also spread horizontally among nodes that belong to the same service.
- A death spiral is a failure that starts with a traffic pattern that causes a node to crash or become very slow, so the load balancer routes new requests to the remaining healthy nodes, which makes them more likely to crash or become overloaded.
Metastable failures
💡 failures that can’t self-recover because of the existence of a positive feedback loop
- This type of failure is characterised by a positive feedback loop within the system that provides a sustaining high load because of work amplification, even after the initial trigger (e.g., bad deployment; a surge of users) is gone.
- Metastable failure is especially bad because it will not self-recover, and we need to step in to stop the positive feedback loop, which increases the time it takes to recover.
- An example of metastable failure is a website that experiences a sudden increase in traffic due to a viral post or ad campaign. The increased traffic causes the website to slow down, which leads to longer load times and higher bounce rates. As a result, the website’s search engine ranking drops, causing even less traffic to the site. This creates a positive feedback loop, where the site’s performance continues to degrade, and it becomes increasingly difficult to recover without external intervention.
Measures to Tackle Microservice Failures
💡 we will discuss how all of these fault tolerance strategies work.
The countermeasures we will discuss are:
- Load Shedding
- Circuit Breaker
- Auto Scaling
- Rate Limiting
Load Shedding
💡 prevents degraded services from accepting more requests
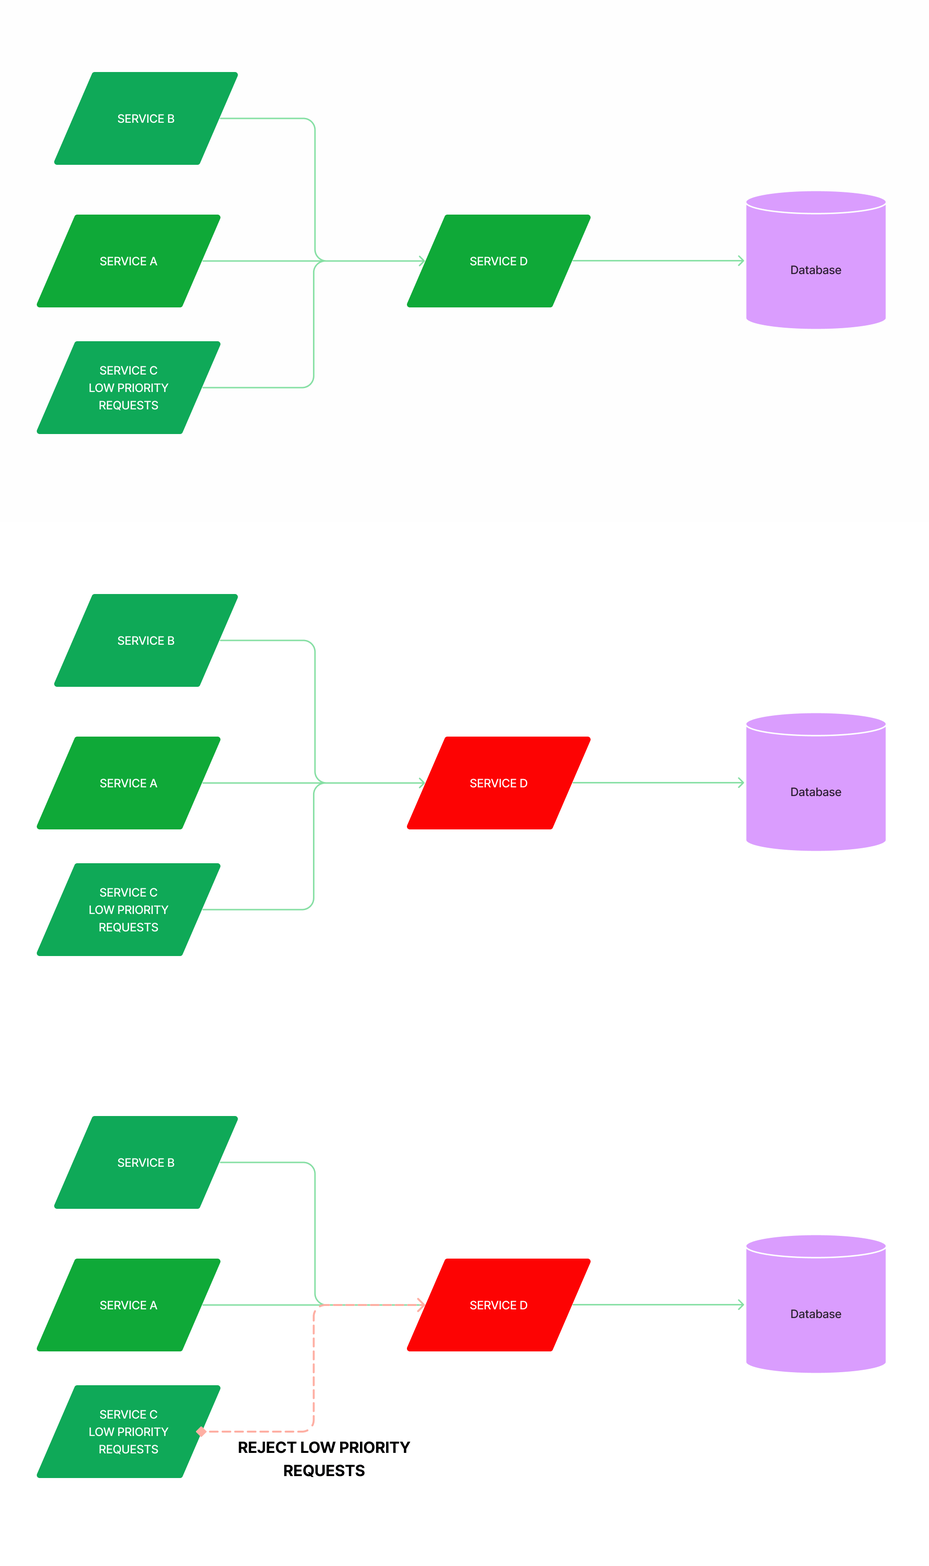
- Load shedding is a reliability mechanism that rejects incoming requests at the service entrance when the number of concurrent requests exceeds a limit.
- By rejecting some traffic we try to maximise the goodput of the service.
- it observes when the latency rises, and reduces the concurrency limit to give each request more compute resources.
- Additionally, the load shedder can be configured to recognize the priorities of requests from their header and only accept high-priority ones during a period of overload.
Circuit Breaker
💡 stops outgoing requests when degraded
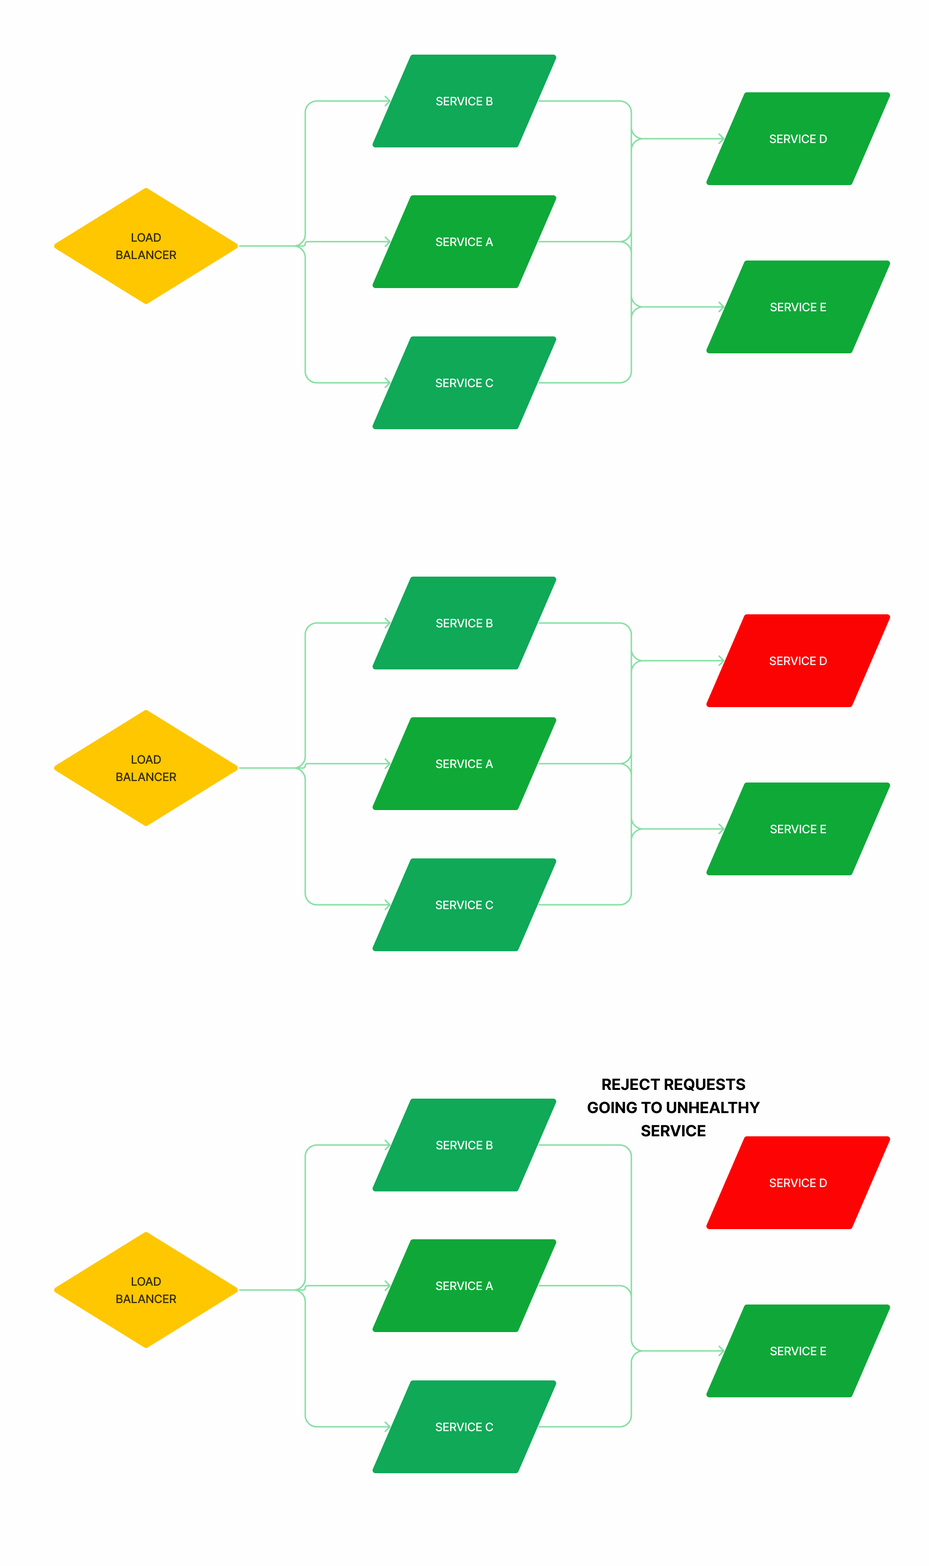
- While load shedding is a mechanism to reject incoming traffic, a circuit breaker rejects outgoing traffic.
- When the error rate from the service exceeds a threshold, the circuit breaker opens, and it quickly rejects all requests to the service.
- After a certain period, the circuit breaker gradually permits more traffic to pass, ultimately returning to normal.
- For example, during a death spiral, unhealthy nodes are replaced by newly started nodes that are not ready to take traffic, so traffic is routed to the remaining healthy nodes, making them more likely to be overloaded. An open circuit breaker, in this case, gives extra time and resources for all nodes to become healthy again.
Auto-Scaling
💡 can help with handling high loads at peak traffic
- When it’s turned on, a controller periodically checks each node’s resource consumption (e.g. CPU or memory)
- and when it detects high usage, it launches new nodes to distribute the workload. This is reactive auto-scaling (i.e. it scales up during a load peak).
- Newly launched nodes require time to warm up, which involves creating caches, compiling code, and other processes that increase latency.
- These new nodes will also perform costly startup tasks, such as opening database connections. A sudden increase in their number can lead to unexpected results.
- During an outage involving a high load, adding more capacity to one service often simply shifts the bottleneck to another area.
- Therefore, it is advised to avoid using reactive auto-scaling and use predictive auto-scaling.
- Predictive auto-scaling uses algorithms to predict future traffic and scale up resources accordingly, in anticipation of increased demand.
- For example, if a website experiences a significant increase in traffic every day at 9:00 AM, a predictive auto-scaling algorithm would anticipate the upcoming peak load and add more resources in advance, avoiding the latency and startup tasks associated with reactive auto-scaling.
- By using predictive auto-scaling, organisations can proactively manage their resources and ensure that they can handle high loads without sacrificing performance or user experience.
Rate Limiting
💡 sets a threshold for incoming requests in a certain period of time.
- Rate limiting can help prevent overload by enforcing an upper limit on the number of requests that can be processed by the system in a given time period.
- For example, a rate limit of 100 requests per minute would prevent a single IP address from sending more than 100 requests in a minute.
- If an incoming request exceeds the rate limit, the system can respond with an error message, such as a 429 “Too Many Requests” status code.
- Rate limiting can be used to protect a system from abuse, such as denial-of-service (DoS) attacks, by limiting the number of requests that can be made by a single IP address or user account.
- It can also be used to ensure that a system’s resources are used efficiently, by preventing users or applications from making more requests than are necessary.
What is MTTR?
- In reality, it potentially represents four different measurements. The R can stand for repair, recovery, response, or resolve, and while the four metrics do overlap, each has its own unique meaning.
- Before we begin tracking successes 🎉 and failures 🥲, it’s crucial to ensure that everyone is aligned.
What is the mean time to Repair?
It is the average time it takes to repair a system. It includes both the repair ⚒️ time and any testing time. The clock ⏱️ doesn’t stop on this metric until the system 💻 is fully running again 🏇🏼
- How to calculate?
- You can calculate MTTR by adding up the total time spent on repairs during any given period and then dividing that time by the number of repairs.
- Let’s consider repairs over the course of a week. During that period, there were 10 outages and the systems were actively being repaired for 4 hours, which is 240 minutes. If we divide 240 by 10, we get 24. Therefore, the mean time to repair in this scenario would be 24 minutes.
What is the mean time to Recovery\Restore?
It is the average time it takes to recover from a system failure. This includes the full-time of the outage ⚰️ from the time the system fails to the time that it becomes fully operational 🏇🏼.
- How to calculate?
- It is calculated by adding up all the downtime in a specific period and dividing it by the number of incidents.
- Say, for example, that our systems experienced downtime for a total of 30 minutes in two separate incidents over the course of a 24-hour period. In this case, our MTTR would be 15 minutes i.e. 30 divided by 2.
What is the mean time to Resolve?
It is the average time it takes to fully resolve a failure. This includes not only the time spent detecting the failure, diagnosing the problem, and repairing 🪛 the issue but also the time spent ensuring that the failure won’t happen again 🔃.
- How to calculate?
- To calculate this MTTR, add up the full resolution time during the period you want to track and divide it by the number of incidents.
- Say, if your systems were down for a total of 2 hours in a 24-hour period in a single incident and teams spent an additional 2 hours putting fixes in place to ensure the system outage doesn’t happen again, that’s 4 hours total spent resolving the issue. Which means your MTTR is four hours.
What is the mean time to Respond?
The average time it takes to respond to a potential system failure ⚰️.
- How to calculate?
- To calculate the mean time to respond, you need to take the total time it took to respond to potential system failures and divide it by the number of failures.
- say if there were 10 system failures in a month and it took a total of 5 hours to respond, the mean time to respond would be 30 minutes. (5 hours / 10 failures = 0.5 hours or 30 minutes).
Summary
In this talk, we explored the concept of MTTR and common categories of failures in microservice architecture. We discussed measures to tackle those failures, including implementing concurrency limits, following incident management best practices, and avoiding death spirals and metastable failures.
Key Takeaways
- MTTR is a critical metric for measuring the effectiveness of incident response.
- Common categories of failures in microservice architecture include network failures, cascading failures, and database-related failures.
- Effective measures to tackle these failures include implementing concurrency limits, following incident management best practices, and avoiding death spirals and metastable failures.
Call to Action
As we continue to adopt the microservice architecture, it is important to remain vigilant in identifying and addressing potential failures. By implementing effective measures to tackle these failures, we can ensure that our microservice architecture remains scalable, flexible, and reliable.
References
Additionally, you can also explore some of our other posts on coding practices like How is 2 git branches workflow more convenient for mobile app development? and Unleashing the Power of Idempotency: Building Reliable and Consistent API Operations
