1. Recap: Why Go Deeper?
After kickstarting Project Reboot, our initial survey gave us baseline insights. But averages hide variance. To design better interventions, we are looking deeper – by slicing our data into meaningful developer cohorts.
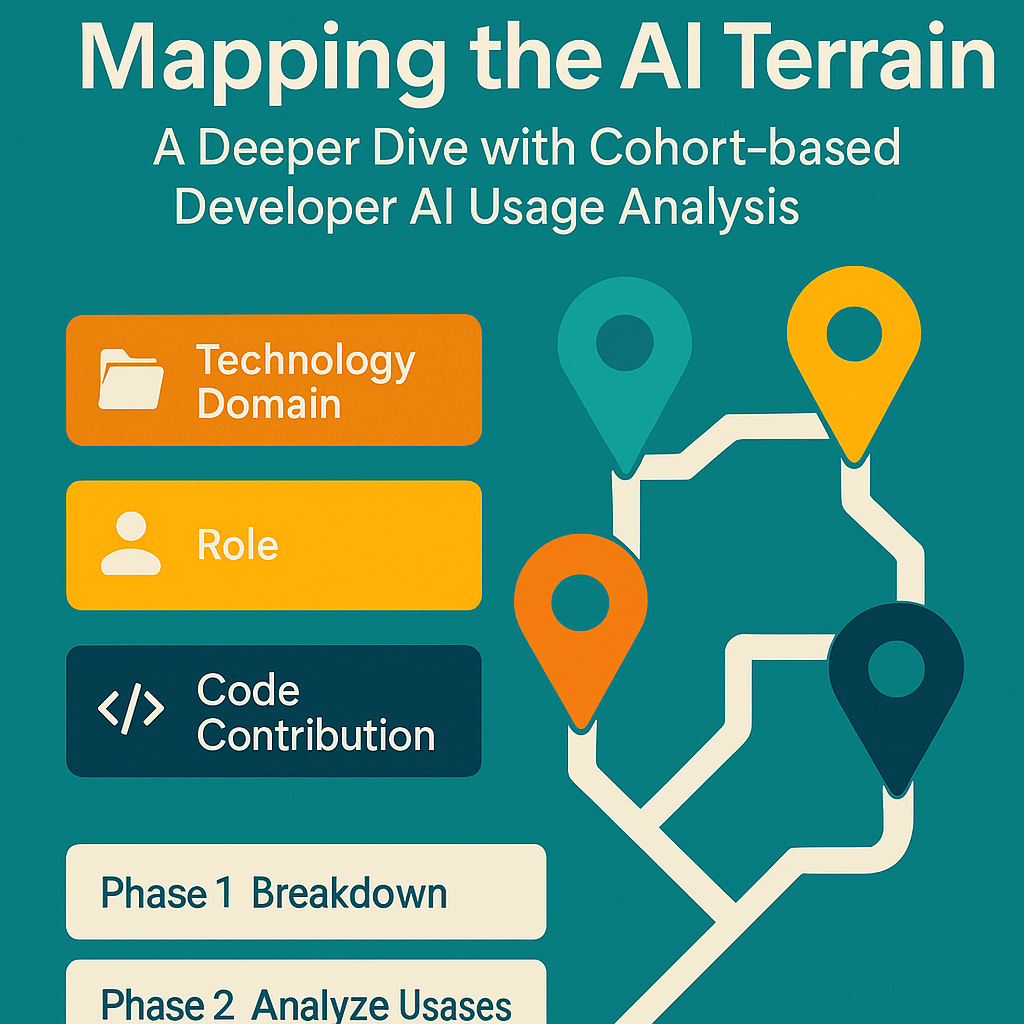
2. The Cohort Method
We plan to group engineers based on some associations such as:
- Tech domain: Mobile, Web, Backend, Infra, etc.
- Editor environment: VS Code, JetBrains, Cursor, etc.
- Role: IC, TL, EM.
- AI tooling preference: Web UI based, IDE integrations based.
- Output contribution based: Less than 25% code is AI generated band, 25-50% code is AI generated band, etc.
And collect data on cohort-specific AI tool usage. This will help us develop a targeted execution plan to achieve higher baseline AI utilization.
3. What We Plan to find
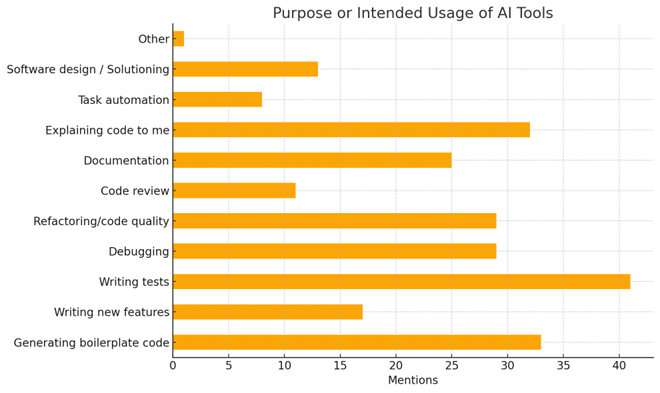
While the org wide assessment provided us with these most common usage intents:
We intend to do an extensive 2-phased cohort analysis to gather more specific and actionable data.
Phases
- Phase 1: Breakdown and determine AI tool use cases per cohort.
- Phase 2: For each cohort, breakdown and analyze usage per quartile.
| Grouping basis | Cohort ID |
|---|---|
| 1. Based on technology domain: A. Backend devs B. Web frontend devs C. Mobile frontend devs D. Infra, platform devs & SRE | COHORT/TECHCOHORT/TECH/BACKENDCOHORT/TECH/WEBCOHORT/TECH/MOBILECOHORT/TECH/INFRA |
| 2. Based on percentage of AI generated code: A. Less than 25% B. Between 25-50% C. Between 50%-75% D. More than 75% | COHORT/PERCCOHORT/PERC/BAND_0_25COHORT/PERC/BAND_25_50COHORT/PERC/BAND_50_75COHORT/PERC/BAND_75_100 |
4. How We Plan to Follow-up
Based on this, we’re:
- Targeting team-specific enablement programs.
- Experimenting with “AI Pairing Hours” in low-usage cohorts.
- Creating a “Best Prompts Repository” per domain.
- Allocating LLM Proxy tool credits by cohort usage growth (Ongoing).
5. What’s Next
We’ll run this cohort analysis again in ~6 weeks. With this data, we aim to not just track progress but build predictive indicators of successful AI adoption.